Human PD-1 enzyme-linked immunoassay kit
| Specification | 96 Test |
|---|---|
| Sensitivity | 0.05 pg/ml (50 μl);1.64 pg/ml (10 μl) |
| Standard Curve Range | 1.37~1000 pg/ml |
| Standard Curve Gradient | 7 Points/3 Folds |
| Number of Incubations | 2 |
| Detectable sample | Liquid phase sample of soluble substances. For example: serum, plasma, cell culture supernatant, tissue grinding liquid, etc. |
| Sample Volume | 50 μl/10 μl |
| Type | Fully Ready-to-Use |
| Operation Duration | 120min |
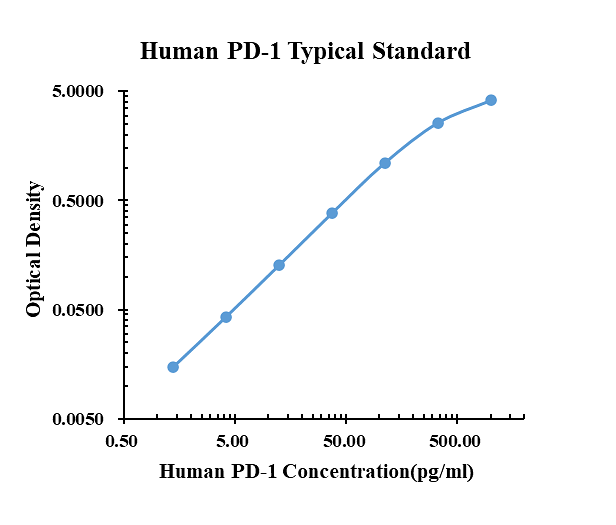
| pg/ml | O.D. | Average | Corrected | |
|---|---|---|---|---|
| 0.00 | 0.0150 | 0.0143 | 0.0147 | |
| 1.37 | 0.0296 | 0.0294 | 0.0295 | 0.0149 |
| 4.12 | 0.0578 | 0.0573 | 0.0576 | 0.0429 |
| 12.35 | 0.1454 | 0.1387 | 0.1421 | 0.1274 |
| 37.04 | 0.3980 | 0.3963 | 0.3972 | 0.3825 |
| 111.11 | 1.1110 | 1.1360 | 1.1235 | 1.1089 |
| 333.33 | 2.6150 | 2.5850 | 2.6000 | 2.5854 |
| 1000.00 | 4.1695 | 4.1661 | 4.1678 | 4.1532 |
Precision
| Intra-assay Precision | Inter-assay Precision | |||||
| Sample Number | S1 | S2 | S3 | S1 | S2 | S3 |
| 22 | 22 | 22 | 6 | 6 | 6 | |
| Average(pg/ml) | 29.9 | 126.7 | 422.8 | 25.1 | 108.9 | 326.8 |
| Standard Deviation | 1.6 | 6.3 | 25.8 | 1.8 | 6.3 | 16.2 |
| Coefficient of Variation(%) | 5.3 | 5.0 | 6.1 | 7.2 | 5.8 | 4.9 |
Intra-assay Precision (Precision within an assay) Three samples of known concentration were tested twenty times on one plate to assess intra-assay precision.
Inter-assay Precision (Precision between assays) Three samples of known concentration were tested six times on one plate to assess intra-assay precision.
Spike Recovery
The spike recovery was evaluated by spiking 3 levels of human PD-1 into health human serum sample. The un-spiked serum was used as blank in this experiment.
The recovery ranged from 82% to 108% with an overall mean recovery of 95%.
Sample Values
| Sample Matrix | Sample Evaluated | Range (pg/ml) | Detectable (%) | Mean of Detectable (pg/ml) |
|---|---|---|---|---|
| Serum | 30 | 90.86-174.38 | 100 | 130.26 |
Serum/Plasma – Thirty samples from apparently healthy volunteers were evaluated for the presence of PD-1 in this assay. No medical histories were available for the donors.
Product Data Sheet
Background: PD-1
PD-1 (Programmed Death-1 receptor) is a key regulator of the threshold of immune response and peripheral immune tolerance. It is expressed on activated T cells, B cells, monocytes, and dendritic cells and binds to PD-L1 or PD-L2. PD-1 ligation induces co-inhibitory signals in T cells promoting their apoptosis, anergy, and functional exhaustion. Blockade of the PD-1: PD-L1 interaction using anti-PD-1 antibodies enhances understanding of anti-tumor immunity and advances the potential for cancer immunotherapy.
